YTD reports: income, earnings, sales etc
"Year-to-Date" or YTD report essentially shows you how a business or an individual has performed financially from the start of the current year up to today's date. It's a running total, giving you a clear picture of progress. So this is a report that filters financial transactions for a current year, summarizes financial results by months (or quarters) and calculates a running total across different categories:
- YTD sales: tracks how much a business has sold / generates a revenue.
- YTD earnings: show the total income an employee (or a customer) has earned.
- YTD investment returns: to determine how an investment is performing.
How to calculate YTD
Let's assume you have a dataset with transactions, something like that:
| date | product_category | sales |
|---|---|---|
| 2026-01-02 | Office Supplies | 264.54 |
| 2026-01-03 | Furniture | 580.96 |
| 2026-01-03 | Technology | 672.93 |
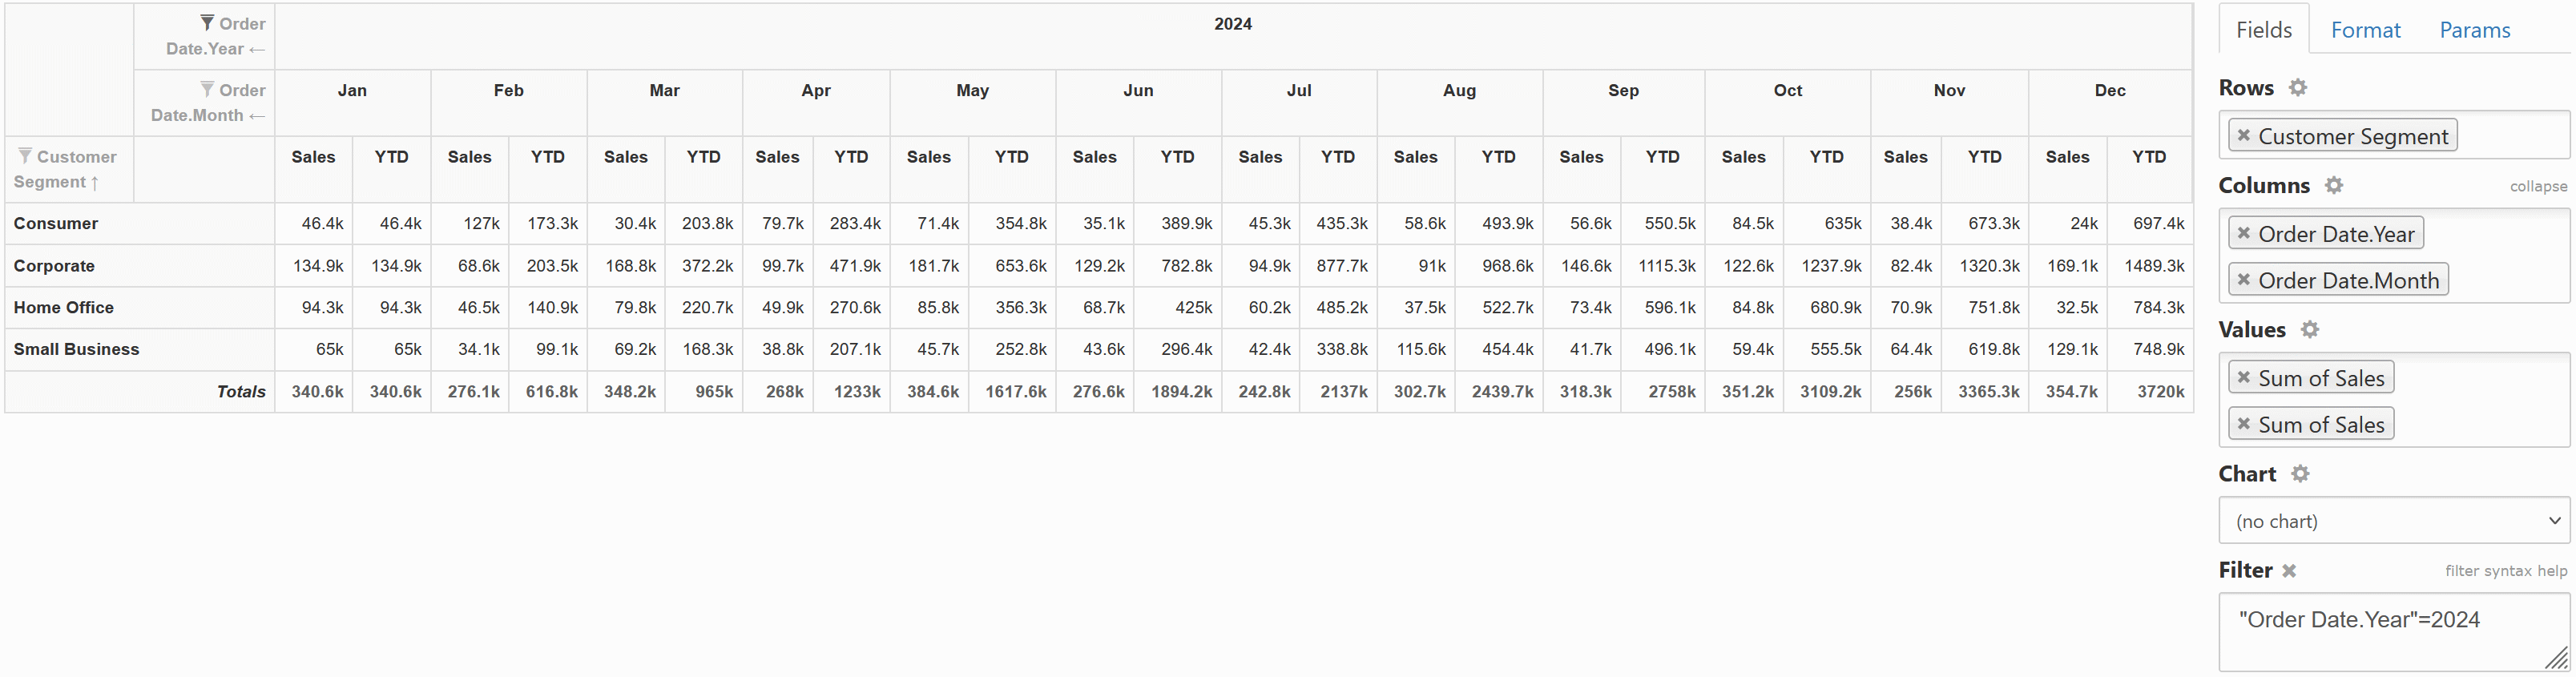
To calculate YTD monthly sales create a pivot table:
-
rows should be filtered by date ("starting from 2026-01-01"),
and the simplest way to that is to choose date's
YearandMonthdimensions on Columns, then set Filter toYear=2026.
This can be done more efficiently by configuring a report parameter (where current year's value may be calculated via expression). - choose a category dimension(s) on Rows. This can be: employees, customers, divisions, expense types, products etc.
-
choose
Sum of sales(amount, income, payout) on Values twice: one to show monthly value, and another one to show YTD value as a calculated running value by row (click near Values):
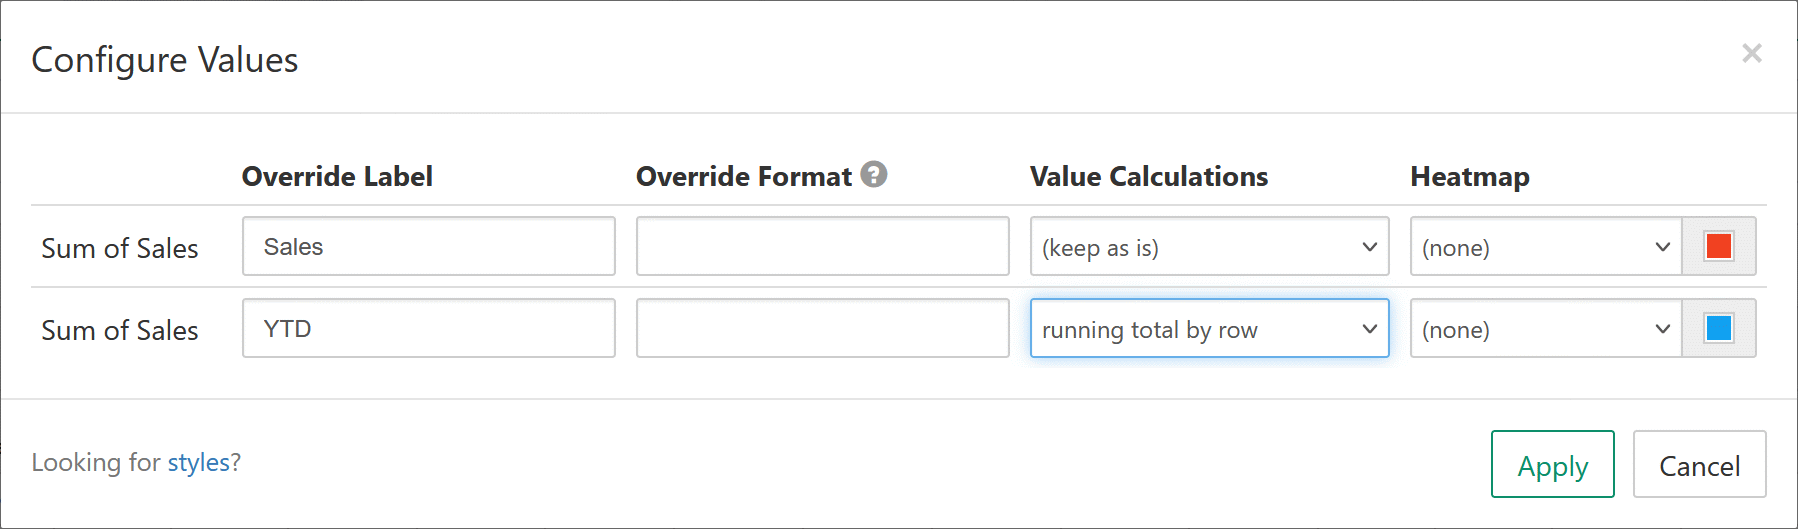
- you may disable Grand Total and Totals Column ("Format" tab) as they simply duplicate YTD values.
As result you should get a report like this:
Adding YTD % (performance or returns)
Once you have a KPI target like projected amount of sales (this can be also previous year's total) you may calculate YTD % - a valuable measure of how well a company's sales are performing throughout the year.
For the sake of simplicity, let's assume that the target value is a fixed constant (in the real report this value can be a part of the dataset, for instance calculated on SQL level). To calculate YTD performance (in %):
- go to cube's configuration form
- add a new parameter with Name=ytd_target and Type=Decimal (a report-specific variable)
- add a new calculated measure with Type=Expression
- enter Parameters:
Parameter["ytd_target"]!=null ? SumOfSales/Parameter["ytd_target"]*100 : nullSumOfSales(refers to measure's name that is used in the formula)
- go to YTD sales report, specify concrete YTD target value in "Params", then add new YTD % measure to Values and specify running value by row calculation (via "Configure Values" dialog).
Finally you should get a report like this: YTD sales performance demo.
Stuck with a YTD report setup? Don't hesitate to contact us!